The UK State of Pay Report 2025
The 2025 average salary in the UK is £37,430 per year.
That means that the average person in the UK has to work for…
- 4 minutes to afford a Mars bar (£1)
- 23 minutes to afford a pint of beer (£6.50)
- 2.4 hours to afford a monthly gym membership (£40)
- 16 (working) days to afford the average monthly rent in London (£2,121)
- 147 (working) days to afford a wedding (£20,000)
- 32 years to afford a London flat (£1,000,000)
You can play around with the calculator below to see some more examples and to figure out how long it takes you to afford the same things.
How long does it take to afford…?
Average Joe / Jane
You
* This calculation assumes the standard tax code for 2025/26 and assumes no employee pension contributions are made. We also assume 5 weeks of paid holiday and 8 paid bank holidays.
This article will demystify compensation in the UK and answer questions like…
- How does the average UK salary differ by age, location, industry, job, etc.?
- What do the top and bottom 10% in the UK make?
- How (un-)equal are salaries in the UK?
- Are there big differences between public and private sector salaries?
- What does the gender pay gap look like?
- How does your salary compare?
You can read front to back or jump to the section that interests you most below.
What this article covers
- A note on data (sources)
- Average UK salary – median vs. mean
- Average UK salary – how it grew between 2000-2025
- UK salary percentiles – from 10th to 99th
- Regional differences in average UK salary
- Average UK salary – by age
- Average UK salary – by industry
- Average UK salary – by job
- Public vs. private sector salaries
- Gender pay gap
- How you stack up
A note on data (sources)
Before we jump right in, here are a couple of notes on the data we use for all of the analysis below.
All data is from the ONS: the Office of National Statistics publishes pay data on an annual basis – all numbers in this article come straight from that official source, which you can check out yourself here.
All numbers describe gross, full-time, total income from work: let’s look at these one-by-one…
- Gross: i.e. before income tax and National Insurance; if you need to convert from one to the other, use a tool like The Salary Calculator
- Full-time: if you work part-time and want to compare yourself to the numbers in this article, ensure that you’re adjusting your pay for a full-time equivalent
- Total income: all numbers include salaries but also bonus pay, incentive pay, overtime pay, etc.
- From work: the numbers don’t include income from assets such as rents, dividends, etc.; they focus only on income from work
Now that we’re clear on the data, let’s check out the numbers.
Average UK salary – median vs. mean

The 2 principal measures of an “average” are the mean and the median.
When looking at the average salary in the UK, the former results from adding up all salaries and dividing them by the number of (working) people. The latter results from looking at the mid-point of all salaries, i.e. the salary at which 50% of the population earn more and 50% earn less. Imagine lining up the whole working population of the UK, with the person earning the least all the way to the left and the person earning the most all the way to the right. The salary of the person standing exactly in the middle is the median UK salary.
Interestingly, the 2025 UK mean salary (£45,836) is actually 22% higher than the median salary (£37,430). Why is that?
It’s because outliers are much more extreme on the high-end than the low end. Look at it this way – even the lowest-paid person in the country will make minimum wage, which is about 0.5x the median salary in the UK.
On the other end of the spectrum, however, one of the best paid CEOs of the country, Denise Coates of Bet365, took home £158,000,000 last year. That’s over 4,000x the median UK salary.
Now, the mean is very sensitive to such outliers, because it adds up all salaries and then divides them by the number of people. One single salary of £158M pushes up the mean salary quite a bit. The median, on the other hand, isn’t sensitive to such extremes at all, because even a £158M salary is just one data point above the mid-point.
That being said, the median isn’t an inherently better or a worse measure of average than the mean. They just measure slightly different things. For the purpose of this article, we’ll use the median as the main measure of average, simply because it’s more robust to outliers.
So, from here on out, when we say “average salary UK”, we mean the median (and not the mean) salary.
Average UK salary – how it developed over time
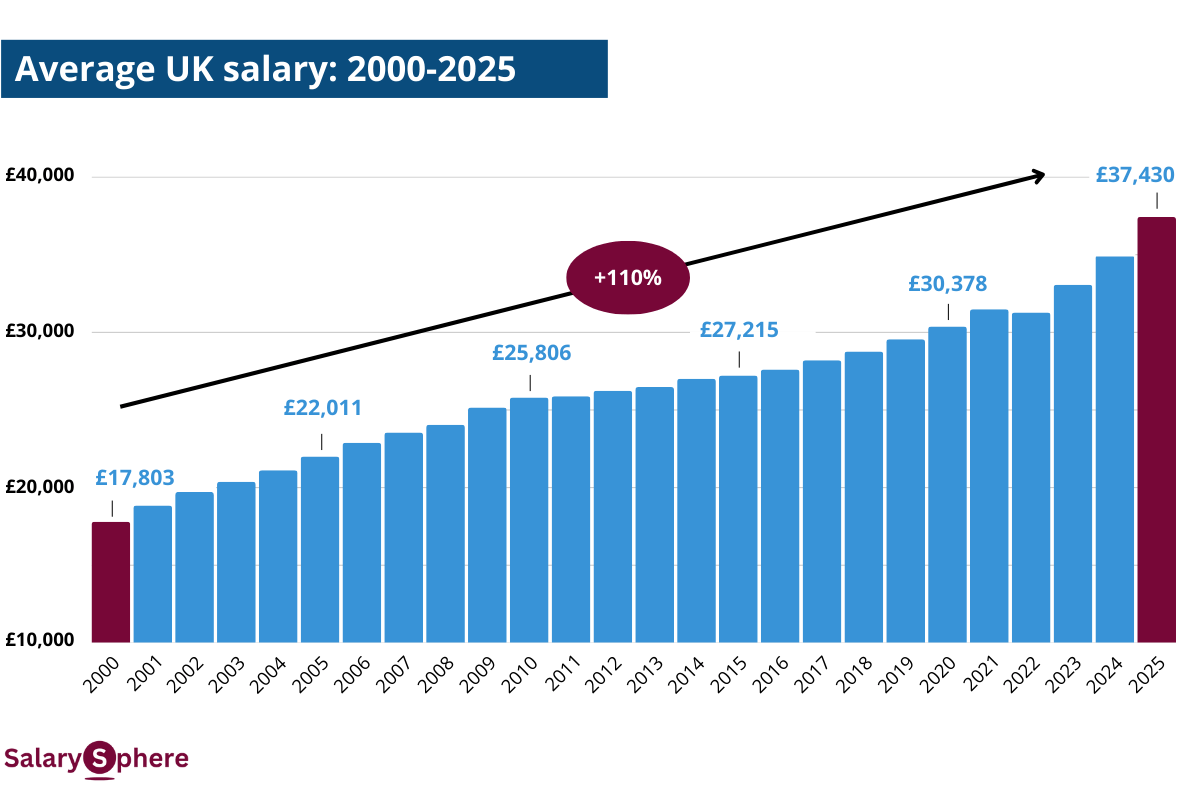
You can see on the very right of the chart that the 2025 average salary in the UK is £37,430 (equivalent to £18.72 per hour or £728 per week). That’s just over double what it was in 2000 (£17,803).
Looks like a big increase in 25 years but actually, it isn’t. That’s because cumulative inflation between 2000-2025 is 87%, i.e. whatever you could buy for £1 back then, will cost you £1.87 now (don’t take my word for it – check out this calculator from the Bank of England).
In other words, whatever you were able to buy for the average salary of £17,803 in 2000 will cost you £33,291 in 2025. That’s only 11% lower than today’s average salary in the UK. So, in real terms (inflation-adjusted), the average UK salary has only increased by a total of about 11% over the last 25 years.
Not exactly a mind-blowing pay rise over that long of a period…
Average UK salary – and other percentiles
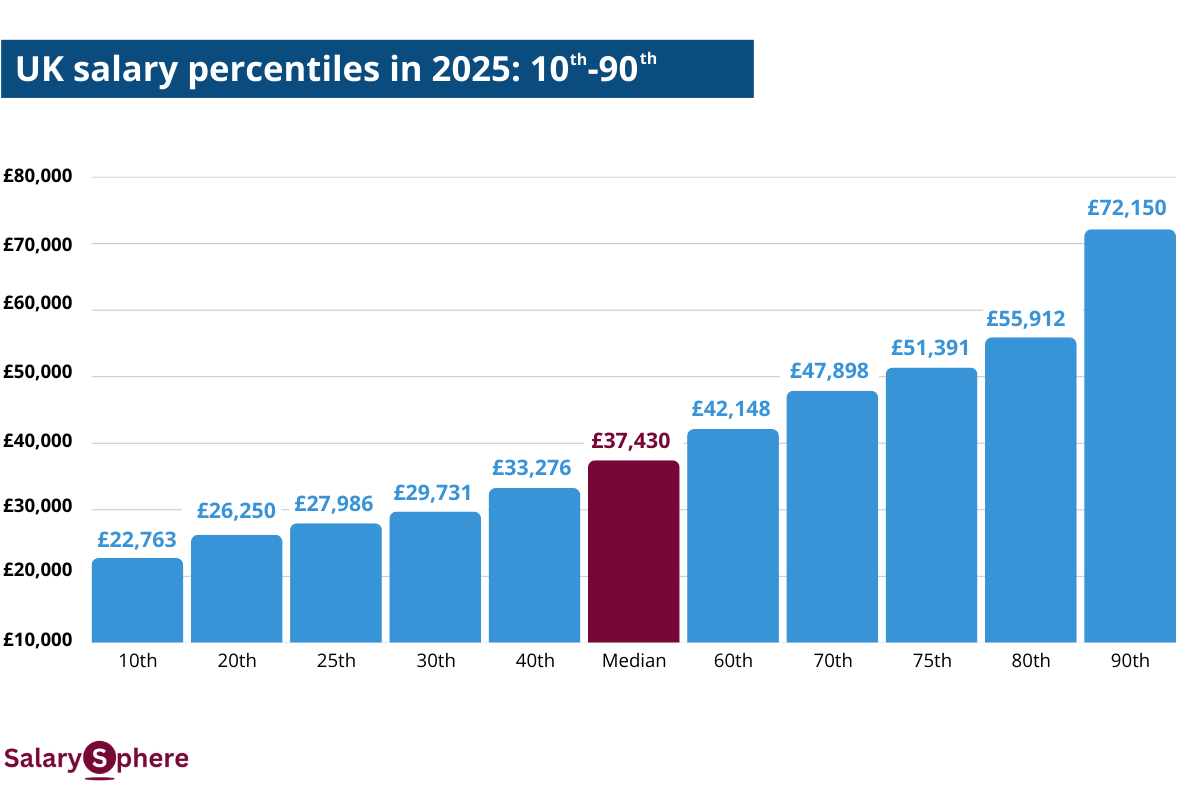
The chart above shows different salary percentiles in the UK. You’ll recognise the median (or 50th percentile) in the middle. As discussed above, the interpretation of the median is that it’s the salary at which 50% of people in the UK earn less and 50% earn more.
Accordingly, the interpretation for the 10th percentile (£22,763) is that 10% of full-time employees in the UK earn less than this amount and 90% earn more than this amount.
On the upper end of the income distribution, the chart tells us if you make £72,150, you’ll earn more than 90% of people in the UK.
The chart also tells us that 50% of people earn between £27,986 and £51,391 (the 25th and 75th percentiles).
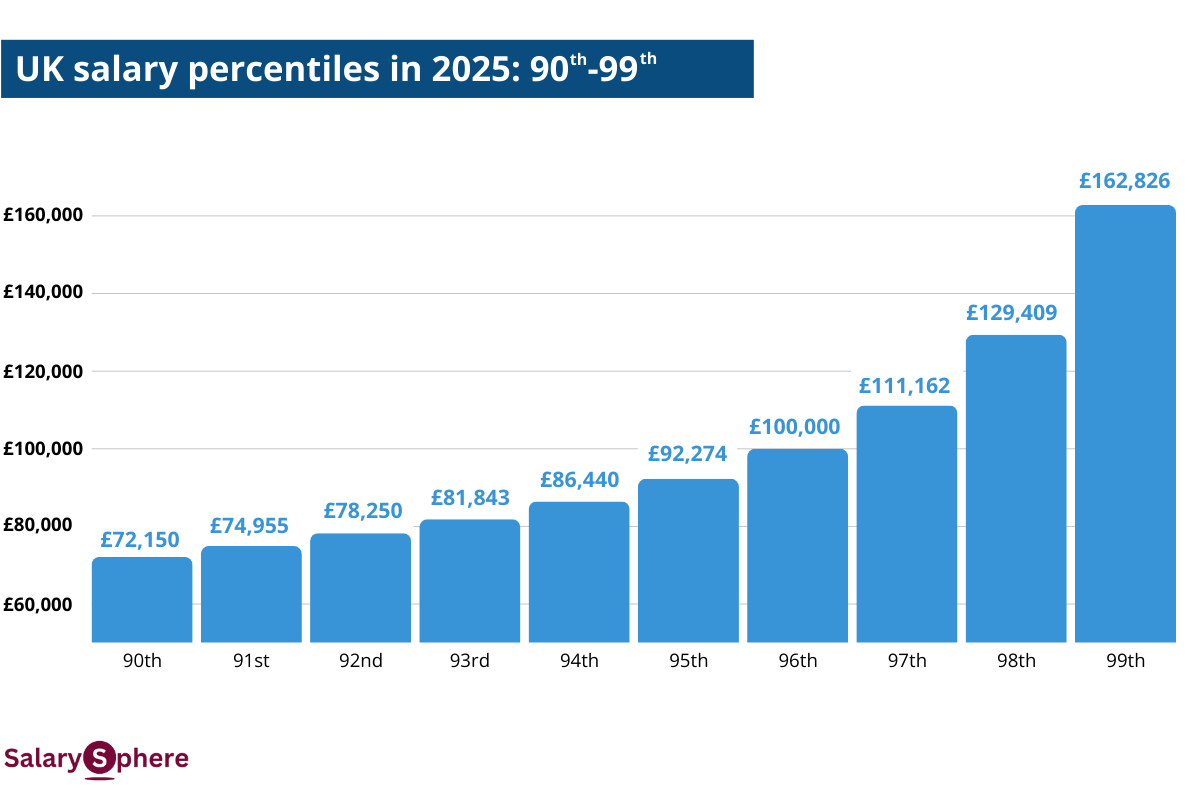
Now, on the top end of the spectrum, things get pretty interesting. We already saw that, if you make £72,150 (which is about 2x the average UK salary), you’re paid more than 90% of the population. But how much do the top 5% make? And how much do you have to earn to make more than 99% of people?
You can see the answers in the chart below– to make the top 5% in the UK, you’ll need a salary of £92,274. To make the top 1%, you’ll need £162,826. And if you make that magical £100k, you’re earning more than 96% of people in the country.
Curious to see how you stack up?
Jump here or click the button below to see which percentile you’re in!
Average UK salary – by region
So far, we’ve only looked at the average salary of all employees in the UK. That’s pretty interesting in and of itself but it puts people in one bucket who work in very different industries, jobs, parts of the country, etc.
So now let’s go a bit more granular and see what the average UK salary looks like for different cross-sections of the population. We’ll start by looking at it on a regional level in the chart below.
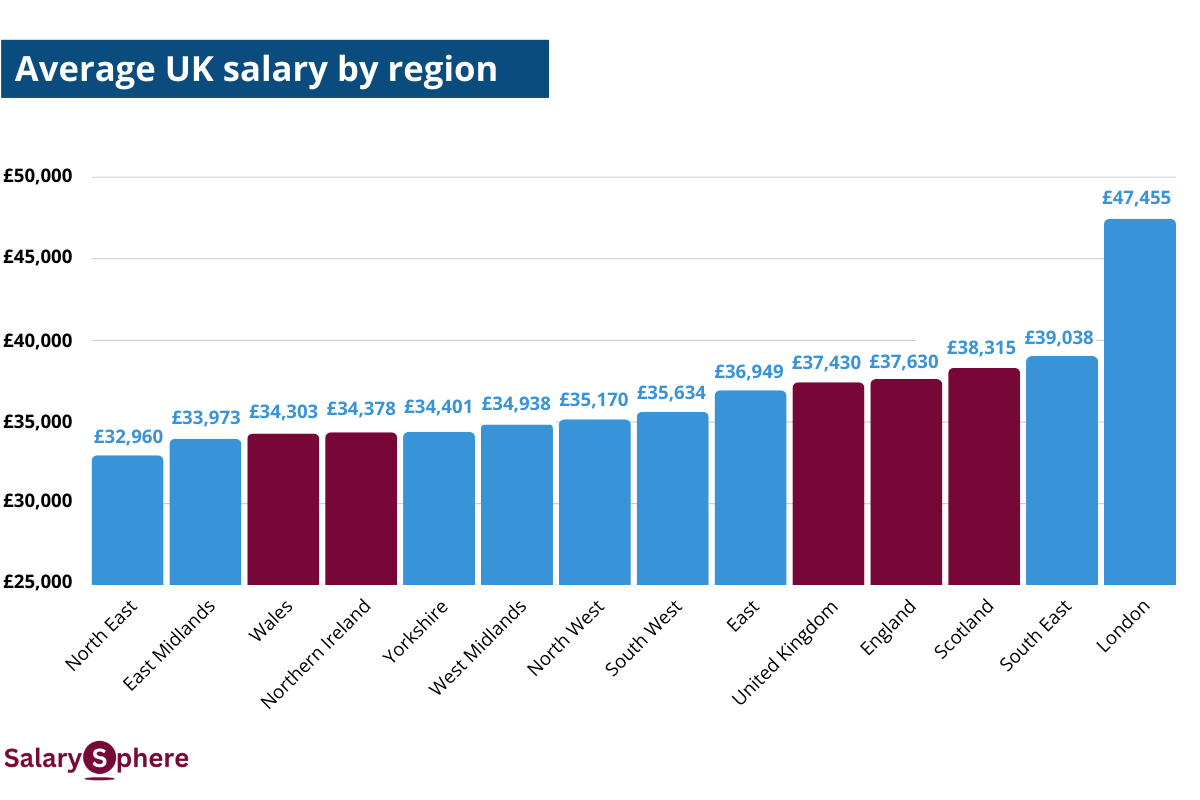
As we can see, there are pretty wide disparities. The average salary in London (£47,455) is about 50% higher than in the North East (£32,960).
We also see that the average salary in Wales (£34,303) and Northern Ireland (£34,378) is about 10% below the overall UK average salary of £37,430. Scotland, meanwhile, sits slightly above the UK-wide average salary at £38,315.
Note also that the average for London (£47,455) is very similar to 70th percentile for the UK overall (£47,898), which we saw in one of the charts above. In other words, if you’re middle-of-the-pack in London, you’re still earning more than 70% of people in the UK as a whole.
The chart below goes a level deeper and looks at the average UK salary by the parliamentary constituency that people live in.

Unsurprisingly, 4 out 5 of the highest-earning constituencies are within London (the one exception being St. Albans in the East). On the other end of the spectrum, 3 out of 5 of the lowest-earning constituencies are in the East Midlands.
We can also see that the average salary in the UK’s highest-earning place (Richmond Park) is more than double that of the lowest-earning place (Leicester East).
Of course, some of these disparities in salary averages across the UK will be “equaled out” by corresponding differences in cost of living. At time of writing, the average monthly rent in Richmond Park is £2,163 per month and the average house price is £788,000. This means that, with the local average salary of £60,702, it would take about 13 annual pay checks to be able to buy a house there.
In Leicester, on the other hand, the average monthly rent is £983, and the average house price is £230,000, which corresponds to “only” about 8 average annual salaries for people living in the area.
Of course the difference in grocery costs won’t be as pronounced as the difference in rent and house prices. Still, while people who live in Richmond Park have a much higher average salary than those in Leicester, they also have a markedly higher cost of living.
Average UK salary – by age
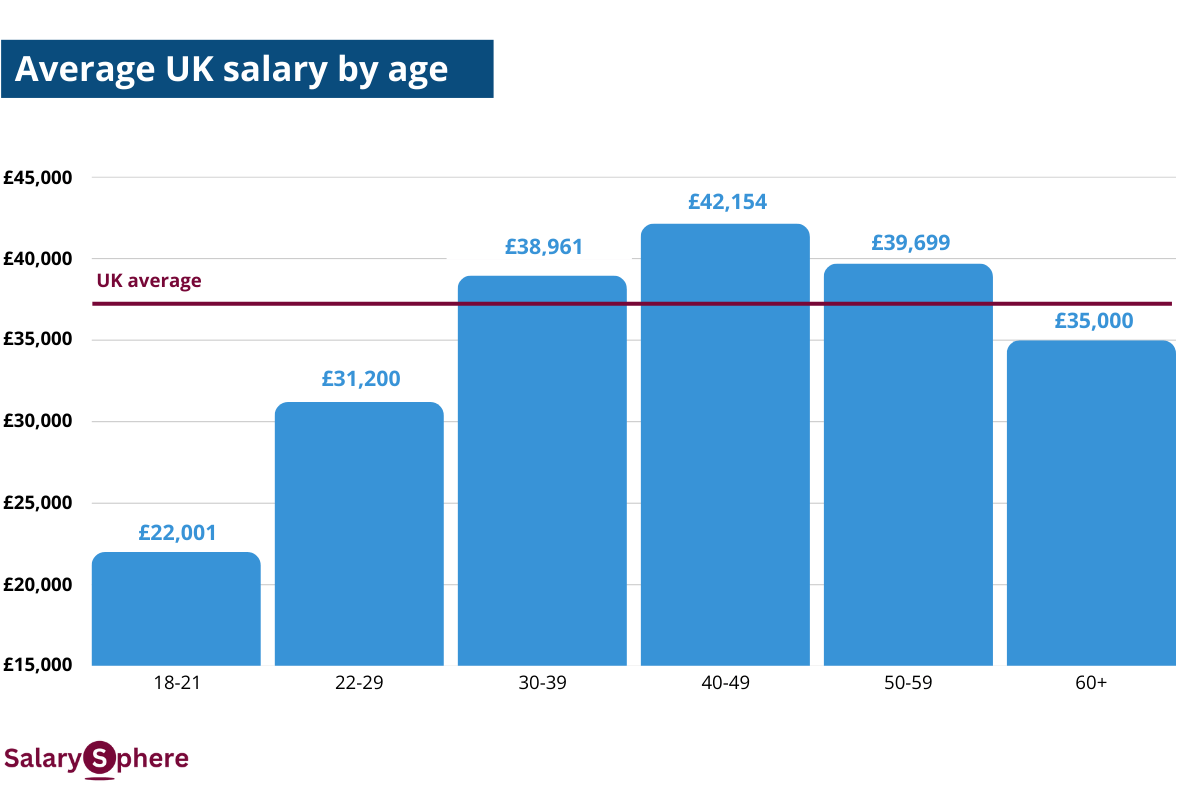
Looking at the average UK salary by age, we can see an interesting trend.
At £22,001, 18-21-year-olds unsurprisingly have the lowest average salary in the UK. This is not just because they’re only starting out and have the least amount of experience, but also because they typically do jobs that aren’t very well paid (think apprenticeships or students jobbing in bars).
Also, people who start working full-time between the ages of 18-21 typically haven’t gone through higher education, which – on average – will mean that they earn lower salaries.
As people in the UK get older, their average salary increases markedly – first to £31,200 for 22-29-year-olds, then to £38,961 for 30-39-year-olds and further to £42,154 for 40-49-year-olds.
This makes complete sense – the young who have joined the workforce early get more experienced and senior and therefore increase their earnings. People who get a university education join the workforce in their later 20s and start out with higher salaries. So far, so good.
But then something interesting happens – the average UK salary drops for people in their 50s and 60s.
Keep in mind, we’re only looking at full-time salaries here, so this can’t be explained by people decreasing their hours.
There are multiple possible explanations for this:
- Those who made a lot retire: The people who made a lot of money in their 30s and 40s may retire in their 50s. Therefore, those people 50+ who remain in the workforce are those who still have to work, i.e. those on lower salaries.
- Voluntary step-downs: People in their 50s or 60s may choose less demanding roles due to changing priorities (better work-life balance, health concerns, etc.). Some may opt for jobs with less responsibility or lower stress, which often come with lower pay.
- Cohort effects: Those now aged 50+ may not have had the same educational opportunities as younger cohorts in the UK and therefore have a lower average salary.
- Particular sectors or roles: Certain high-earning sectors (like Tech or Finance) skew younger. In contrast, older full-time workers may be overrepresented in sectors like Education, Public Services, or certain Admin roles, which have flatter pay scales.
Let’s take a deeper look at that last point and see what the average UK salary looks like in different industries and jobs.
Average UK salary – by industry
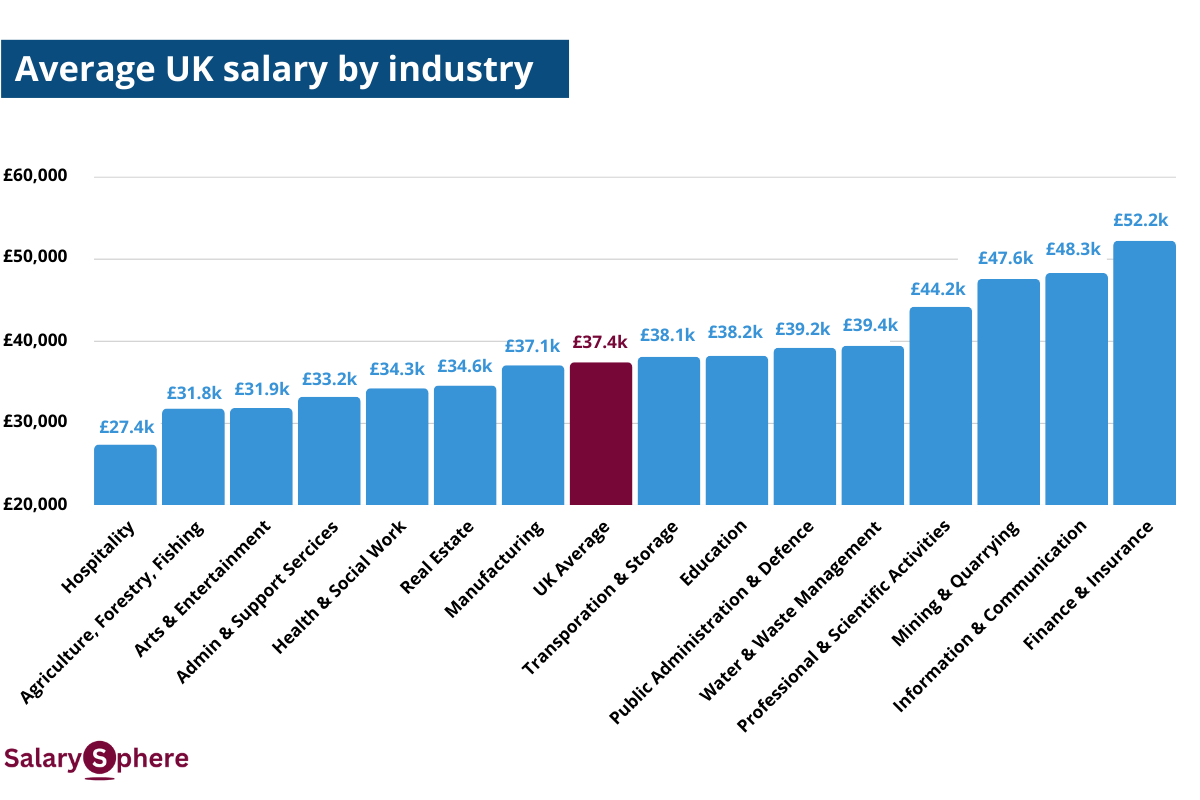
The average UK salary differs widely between different industries – while people working in Hospitality (e.g. waiters, cleaners, bar staff) make an average salary of £27,400, those working in Finance & Insurance take home an average salary of £52,200.
To a large extent, this is driven by the types of jobs that are available in any given industry. Sticking with the example above, there are lots of jobs in Hospitability that don’t require a university degree or advanced training. In Finance & Insurance, on the other hand, jobs will tend to be more white-collar and higher-paid (though of course there will also be jobs that pay relatively little, like Receptionists or Assistants).
So, for the most part, it’s not so much that one industry pays better than another; it’s more that some industries heavily rely on more specialised (high-earning) jobs, while other industries are dominated by less specialised (low-earning) jobs.
That being said, there is an element of some industries paying more for the same job than others. If you’re an Accountant, for instance, you could work in any of the industries above. Hotels and restaurants need accountants, as do museums, schools, mining companies and banks. Chances are, the banks would pay you more than the museums, simply because they tend to be more profitable / have more money to spend.
So in some cases in does pay (literally!) to choose your industry wisely.
Average UK salary – by job

There are way too many jobs to list them all so we’ve selected a few interesting ones and put the average UK salary for each of them into the chart above.
As you can see, there are huge differences. On the lower end of the income spectrum, childminders, assistant teachers, waiters and cleaners all have salaries between £20,000-23,000, on average.
On the higher end of the spectrum, Chief Executives take home around £88,000, i.e. approx. 4x more.
But you don’t need to be a high-level executive to make a comfortably-above-average salary in the UK. Train, tube and tram drivers have an average salary of about £64,000, as do senior police officers.
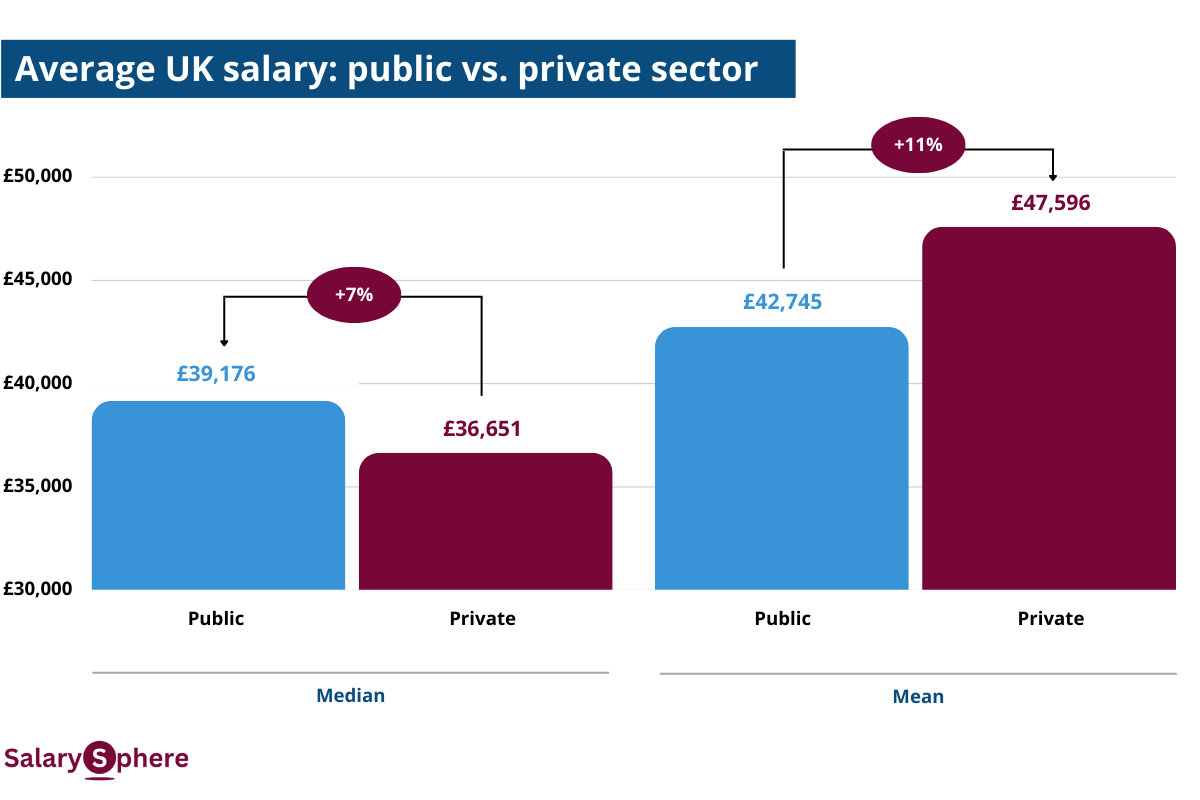
Average UK salary – public vs. private sector
Now this one is fascinating.
As we can see, the median salary of public sector workers in the UK is about 7% higher than that of people employed in the private sector.
However, when we use the mean as our measure of average, the whole picture is flipped on its head. Suddenly, people in the private sector outearn those in the public sector by 11%.
Why is that?
It’s because the private sector has more extremes on the high end of the income spectrum than the public sector.
The median private sector salary is relatively low because there are lots of hairdressers, waiters, cleaners, bakers, etc. in the private sector who make relatively low salaries. These large numbers of low-paid workers bring the mid-point of salaries down. However, on the upper end, there are extremely well-paid executives who could earn thousands of times the average salary and thereby push up the UK mean. Hence, you have a relatively low median but a relatively high mean.
In the public sector, on the other hand, the extremes are less extreme. 2024 saw a big outcry about Sue Gray’s £170,000 pay check and she was arguably one of the best-paid people in the public sector. This outrageous £170k salary is about 0.1% of the salary Bet365 CEO Denise Coates.
So, when it comes to salary, if you’re going to be at the top, it’s much better to be at the top in the private sector. However, if you’re going to be middle-of-the-pack, it’s better to be in the public sector.
Average UK salary – by gender (incl. gender pay gap)
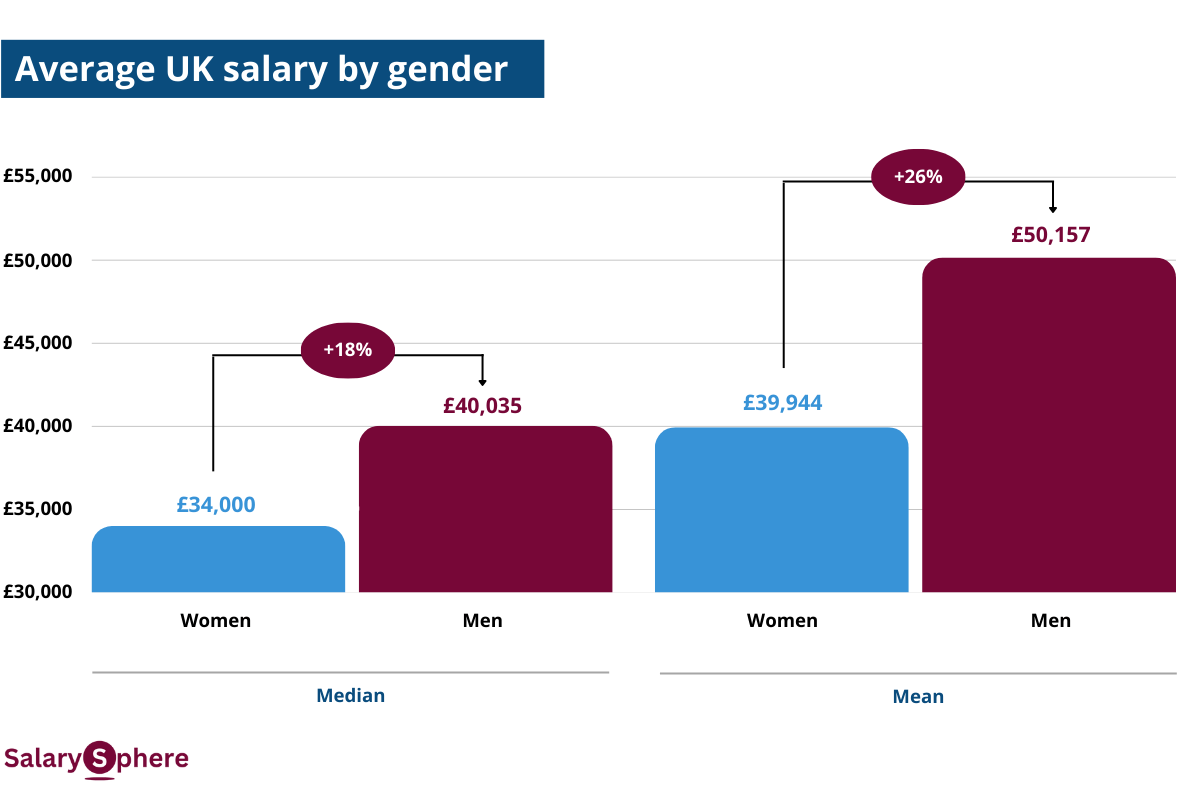
Finally, let’s take a look at differences in average salary between men and women as well as the gender pay gap in the UK.
As we can see, the average UK salary is higher for men than women, no matter whether we look at the median (£40,035 vs. £34,000) or the mean (£50,157 vs. £39,944).
That means that, looking simply at the difference between the average salary for men and women in the UK, the gender pay gap is 18% using the median and 26% using the mean. This is what’s called the unadjusted gender pay gap.
The adjusted gender pay gap, on the other hand, controls for factors such as tenure, sector, role, i.e. it looks at the difference in pay between men and women doing the same job, with the same level of experience.
Now, there is a lot of research and literature about the gender pay gap but in short, it’s mainly driven by the following factors:
Drivers of the unadjusted gender pay gap
- Men tend to be in jobs that pay better: Women are overrepresented in lower-paid sectors (e.g. care or education) and underrepresented in higher-paying fields like tech, finance, and engineering. Even within organisations, women are more likely to be in support rather than technical roles.
- Men tend to be in more senior positions: As seniority increases, the representation of women drops, especially in the private sector. This is likely linked to the next point.
- Women tend to be penalised for taking maternity time: Women are more likely to take time off for childcare or work part-time after their maternity leave. These career interruptions mean women often miss out on promotions, pay rises, and compounding salary growth.
Drivers of the unadjusted gender pay gap
- Women tend to be less inclined to negotiate their salaries: On average, women are less likely to negotiate, and when they do, they may be penalised more for it. If you’re a woman and about to (re-)negotiate your salary, don’t let this stop you – check out some tips & tricks on how to negotiate effectively and with zero awkwardness.
- People discriminate / have bias against women: Finally, there’s good old discrimination. Women may be offered lower starting salaries, promoted more slowly, or evaluated differently for the same work.
Each of the points above has its own underlying drivers but the result is the same for each of them – they all pull down the average salary for women in the UK.
How you stack up
Right, we’ve looked at the average UK salary from plenty of different angles – now it’s time to figure out how you stack up.
Try out the calculator below to find out what salary percentile you’re in, exactly.
Want some more detail on how you compare within your region, industry, job, seniority level?
Sign up to our newsletter and we’ll let you know when our full benchmarking tool is ready. In the meantime, you’ll also get a monthly dose of insights around pay and compensation – highly curated to the same standard as this report.